In the dynamic landscape of financial management, gaining insight into the week-to-week costs of your site and payroll is a fundamental aspect of strategic decision-making. This comprehensive guide is tailored to empower you with the knowledge to effectively navigate Alkimii's Week Costs Screen, unravelling the complexities of forecasted, budgeted, and actual costs. Understanding this interface is key to obtaining a comprehensive view of your financial landscape.
- Using the mega menu, navigate to "Week Costs"
The data on this screen is role dependent so it may differ from person to person. For example, HODs will have access to reduced data on this screen that will allow them to view real-time data and respond accordingly.
- Your default view will be "All" departments in the current week.
- If you wish to review the information for a specific week, use the calendar function in the top left corner.

- You can also review specific department performance for the week by selecting the department using the department selector at the bottom.
Staff
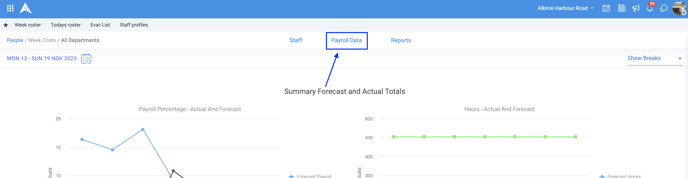
- Here you can see a breakdown of the summary forecast and actual totals for your staff in your site.
- In the top right corner, you can filter your data by "Show Breaks", "Hide Breaks" or "Forecast, no breaks". With the forecast option, this will show you what changes have been made since the forecast was frozen.
- The first graph on the left compares Forecast, Actual and Budgeted payroll percentages for the specified week. Here you will be able to see how the site or department is performing.
/Team/Week%20Details/Pay%20%25%20bud%20fore%20actual.png?width=395&name=Pay%20%25%20bud%20fore%20actual.png)
- The graph on the right displays compares the forecast, worked and budgeted hours for the specified week. Here you will be able to see how the site or department is allocating the hours for the week against their estimates.
/Team/Week%20Details/Hours%20Bud%20For%20Actual%20.png?width=401&name=Hours%20Bud%20For%20Actual%20.png)
- The data from both graphs is also displayed in a table format below the graphs. This information is broken down by day comparing Budget, Forecast, and Actual.
- At the bottom of this table, you can see whether the Overall Daily Sign Off has been completed for the day. This is important as you will not be able to process payroll with days unsigned.
/Team/Week%20Details/Week%20Details%20screen%20ish.png?width=422&name=Week%20Details%20screen%20ish.png)
- If you are within a specific department, the figures reflect the department you are in.
- Below this table, you will see cost details by staff member. This is essential a timecard to show all rostered shifts per employee.
- Non-worked shifts are shown with a red button indicating the type of absent shift set, whether its holiday, sick leave, training shift etc.
- Supervisor/Self Check rated shifts are highlighted with a grey bubble
/Team/Week%20Costs%20shifts.png?width=504&name=Week%20Costs%20shifts.png)
- Forecasted and Actual hours are shown. The variance column shows under/overworked hours. Only Accountant-level access has the right to see a break cost per employee
/Team/Week%20cost%20hoursvarieance.png?width=276&name=Week%20cost%20hoursvarieance.png)
Payroll Data
- To access the payroll data, including the Payroll export for closing your payroll for the week, select the "Payroll Data" header along the top.
- Here you will be able to preview the "Timesheet audit" file. This can be used as a final check to see what hours are being paid out for your staff under the different categories such as basic or holidays. It's an insurance check to review before you run your payroll.
- This is where you go to close out payroll for the week and where you can download your "Cost Analysis"
Reports
- To access any audit data in report format, navigate to the "Reports" header along the top

For help closing Payroll, click here!