
Maintenance allows for both reactive and proactive tracking of issues within your site. The maintenance dashboard provides quick and easy visibility of all issues logged.
Key Terms to Understand
| Reactive Maintenance | Real-time maintenance tasks logged via phones, ad hoc, as issues come up. |
| Proactive Maintenance | Completing scheduled location reviews to stay ahead of potential maintenance tasks. |
| Task | An issue or detail logged that the maintenance team need to action |
| To do | A task that has been logged but not yet started. |
| Doing | A task that is currently being worked on. |
| Done | A task that has been completed. |
Getting Started
Using the menu search bar, navigate to Maintenance. Your view will default to the Maintenance Dashboard.
Filtering Your View
At the top of the dashboard, you can filter by:
- Site - choose the property you want to view (dropdown if you have access to multiple sites)
- Dates - set the time period you want to report on
In the top right, you'll also find:
- Reset - clears your filters
- Default View - saves this as your default view when you open the page
- Print - prints the dashboard
Task Overview Tiles
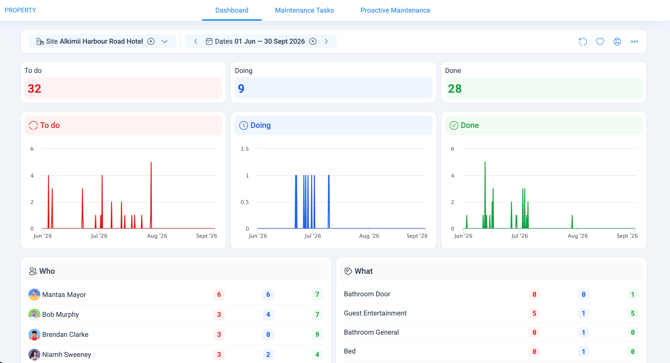
Below the filters, three tiles give you a quick snapshot of your tasks:
- To do - tasks logged but not yet started
- Doing - tasks currently being worked on
- Done - tasks that have been completed
Each tile shows the total number of tasks, along with a graph underneath showing how that number has changed over your selected date range. This lets you see at a glance when tasks were logged, picked up, or finished for the specified date range.
💡 Quick Tip: If you always want to see year to date, use the date filter and save this as your default view.
Who: Team Workload
The Who panel lists each team member, along with the number of tasks they have: To Do, Doing and Done. This gives you a quick view of workload across your maintenance team.
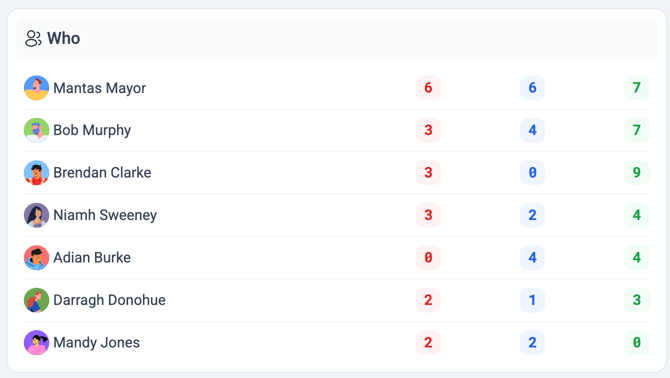
To set up your maintenance team, click here and see our help article to follow along.
What: Categories
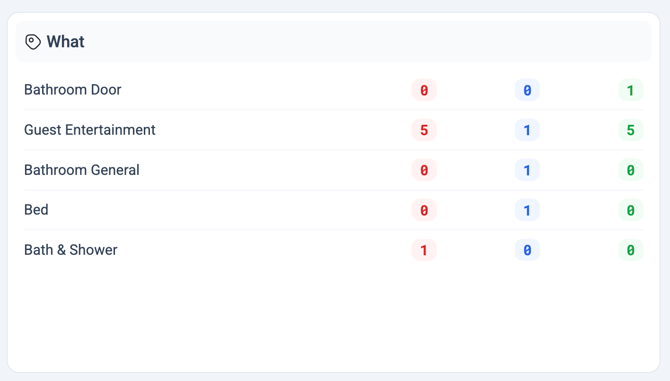
The What panel lists tasks by category, showing the number To do, Doing and Done for each.
This is linked to the category associated with your inspection list or maintenance tasks. You can add additional categories within the App Settings in Alkimii. It's important to have these set up correctly so your information is pulled through accurately.
For help creating maintenance categories in the App Settings, click here!
Where: Locations
The Where panel lists tasks by specific location, such as room number, restaurant or plant room, again showing the number To do, Doing and Done for each. This is useful if you want to see whether issues are building up in a particular area of your site.
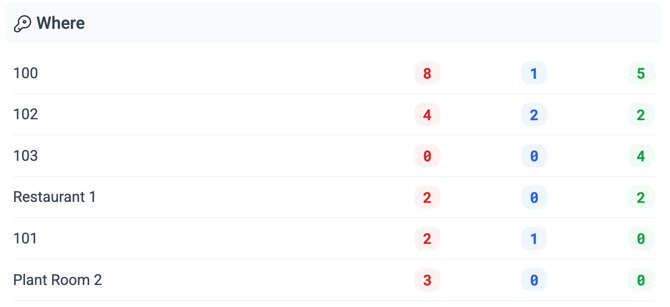
💡 Quick Tip: Click on any category title in What, or any location in Where, and you'll be taken straight to the Maintenance Tasks tab, filtered to show every task logged under that category or location.
When: Timing
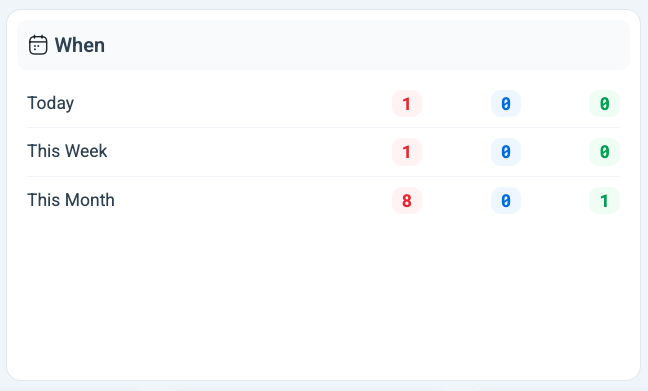
The When panel shows how many tasks fall To do, Doing and Done across time periods like Today, This Week, This Month. This helps you keep an eye on how quickly tasks are being picked up and resolved.
Viewing Individual Tasks
To view individual tasks, head to Maintenance Tasks from the top menu. This gives you the full list of logged tasks, most recently logged first.
Exporting the Dashboard
The dashboard can be printed or exported for further investigation, showing:
- All locations viewed over your selected date range
- Tasks To do, Doing and Done