
⚠️ This feature is not available for user on the Alkimii Lite subscription.
- To view the analytics tab within the roster, you will need to enable it.
- To enable click "Analytics" in the top right corner. This will open the tab to the left of your roster view.
- You will now be able to see a headcount for each day of the week based on the number of shifts rostered.
- There will also be a preview of the "Hours" - forecast, actual and variance at a glance beneath the day within the roster view.

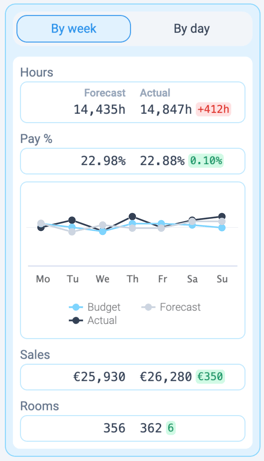
Analytics: By week
|
 |
|
💡 Top tip: Each department shows sales figures specific to that department. For example, Kitchen shows food sales rather than overall site sales. Use this to compare your rostered hours against the correct sales figure for your area, making it easier to stay within your target pay %. |
|
Analytics: By day
|
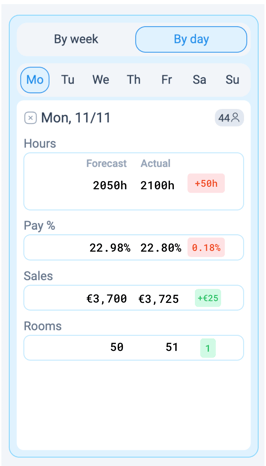 |
| 💡 Top tip: Sales figures shown here are also specific to each department for example, selecting Kitchen will show that day's food sales rather than the site's total. This makes it easy to check, day by day, whether you're on track against your target pay %. | |
- If you have the ability to complete the overall day sign off, you can also access the sign off monitor from this view. Simply click on the day "Mon" within the analytics by day view to see at a glance what departments have completed their sign off for the week.
For more information on completing the overall daily sign off in the roster, see our help article.